Having spotty internet connection is worse than having no internet at all.
In the apartment we are living now the internet is great 95% of the time. The remaining 5% were annoying enough to get serious about fixing the problem.
I should note that I’m a noob when it comes to networks. In retrospect I should have figured it out sooner. But it was a fun yak shaving expedition I want to share with you.
Step 1: Understand the problem
The symptom was the same: at random times the internet connection would just disappear. WiFi signal was strong, but no traffic is getting through.
We called ISP but got nothing useful: they said metrics on their end looked good, no disruptions in service.
I needed a way to prove that something was wrong.
I built a script that every 5 minutes downloaded a 25MB file and recorded what the download speed was. It also logged errors. Finally I could put the Raspberry Pi I had to good use!
#!/bin/bash

url="https://speedtest....:8080/download?nocache=..."
speed=$(curl -Lo /dev/null -skw "%{speed_download}" $url)

if [ $? -eq 0 ]
then
  echo "Speed: $speed" >> /var/log/dload.txt
else
  echo "Error" >> /var/log/dload.txt
fi
I’ve added the script to crontab:
$ crontab -e

*/5 * * * * /home/pi/inet/dload.sh
Unfortunately, the first half hour of running this didn’t reveal any problems (except underwhelming connection speed). I’ve decided to up my game a little and use production grade tools.
Installing and configuring Grafana
I always wanted to learn more about Grafana, and this sounded like a perfect opportunity. I thought plotting the results of the download script would help me investigate the problem.
I’ll skip the part where I tried different backends for storing the data. I didn’t care much about any particular solution, just needed something basic to store enough data to plot a simple bar chart. However, every tool tries to sell itself as enterprise level, high scale, etc. and comes with five million services that make up an advanced distributed architecture.
In the end I settled with influxdb (1.x branch because 2.x didn’t have binaries for armv7l)
$ echo "deb https://packages.grafana.com/oss/deb stable main" | sudo tee -a /etc/apt/sources.list.d/grafana.list
$ echo "deb https://repos.influxdata.com/debian $(lsb_release -cs) stable" | sudo tee /etc/apt/sources.list.d/influxdb.list
$ wget -qO - https://packages.grafana.com/gpg.key | sudo apt-key add -
$ wget -qO - https://repos.influxdata.com/influxdb.key | sudo apt-key add -
$ sudo apt update
$ sudo apt install grafana influxdb
$ sudo systemctl daemon-reload
$ sudo systemctl unmask influxdb.service
$ sudo systemctl enable grafana-server.service
$ sudo systemctl start grafana-server
$ sudo systemctl start influxdb
I confirmed Grafana worked on 192.168.1.XXX:3000 and that it could connect to the local Influxdb instance.
Logging data to Influxdb was pretty easy, it’s just a POST request to its built in HTTP server. When we log the data, Influx requires a table name, list of 0 or more key-value pairs (tags) and list of 1 or more values. We could also give it a timestamp, but skipping it just uses the event’s time of arrival.
bashtable,tag1=foo,tag2=bar value=42
With this, I had to change the download script to log proper events to influx:
if [ $? -eq 0 ]
then
  curl -XPOST 'http://localhost:8086/write?db=inet' --data-binary "speed dl_bps=${speed}"
else
  curl -XPOST 'http://localhost:8086/write?db=inet' --data-binary "error value=1"
fi
Note that I used a different event name for errors, this is to make it easier to plot them on the graph (zero or negative values did make the graph look less pretty and messed with things like average/p90 speed calculations).
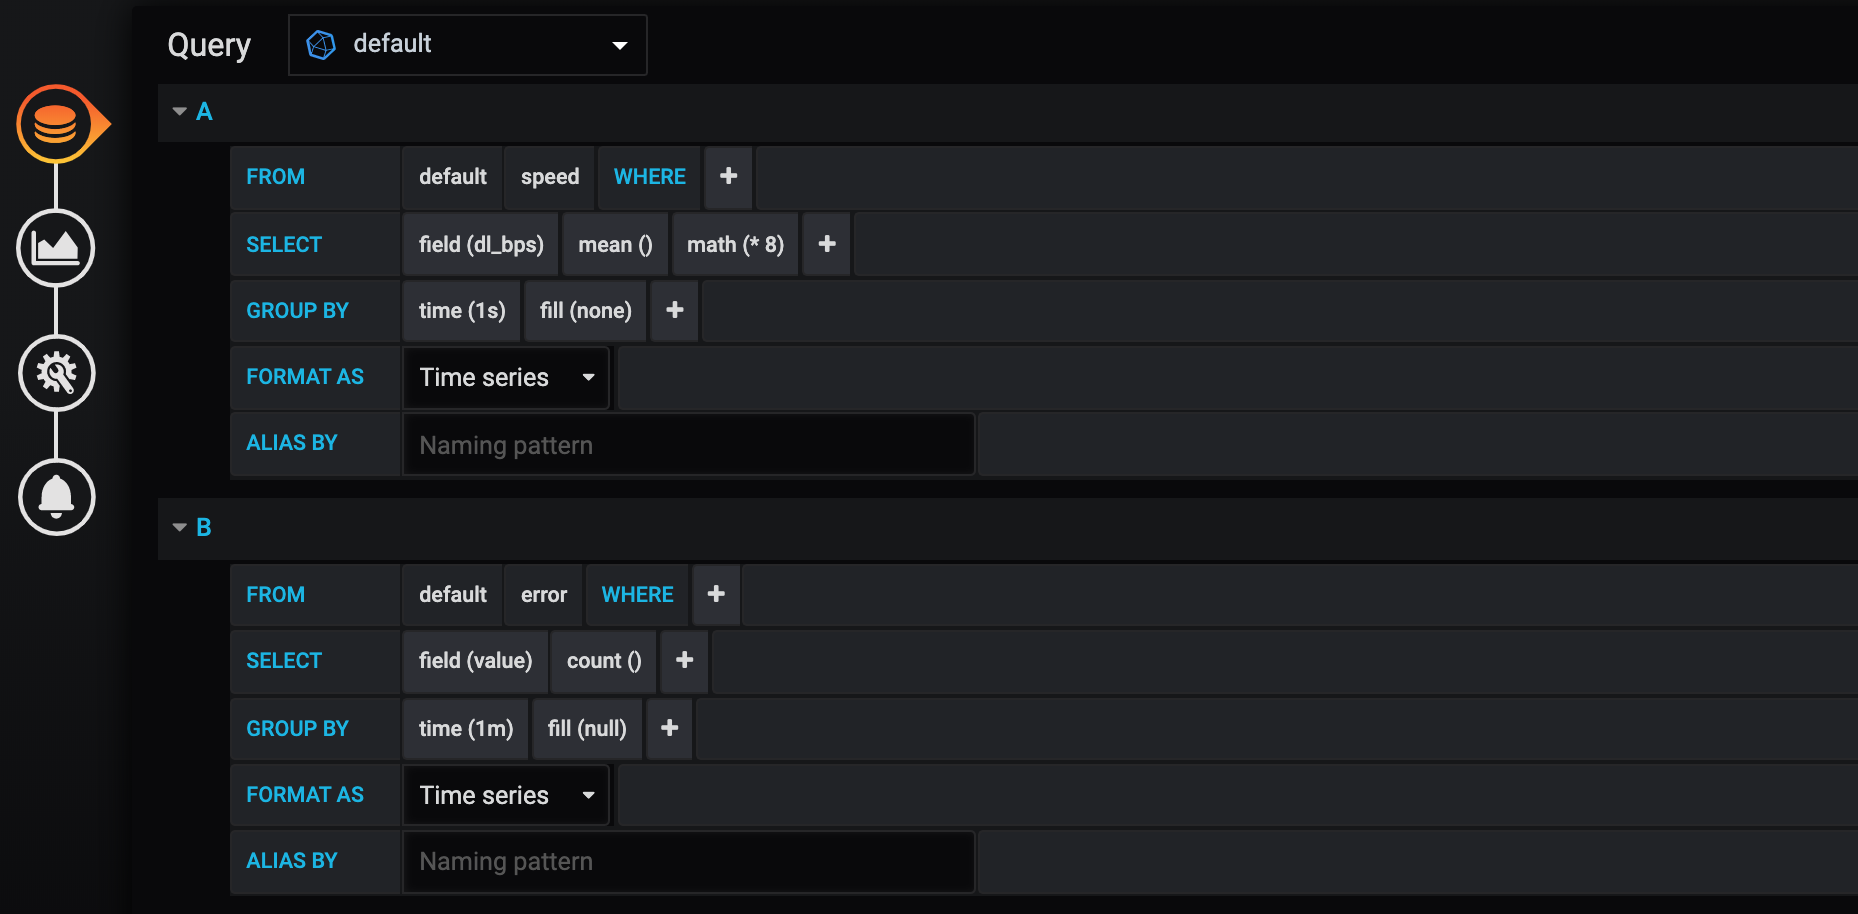
This is the query in Grafana. Few things to note here:
- I used
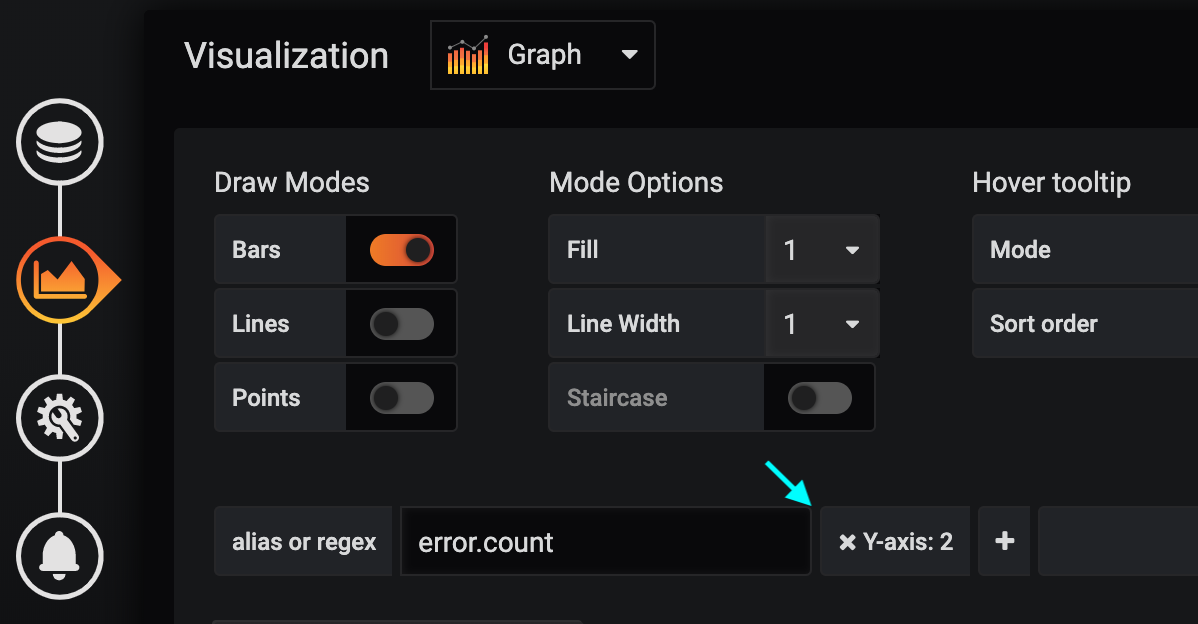
math (* 8)operation to get //bits per second//, since that’s how ISP refers to the value - The errors are plotted as a different graph. From the download script you can see that error value can only be 1, I had to tell Grafana to use a different Y axis
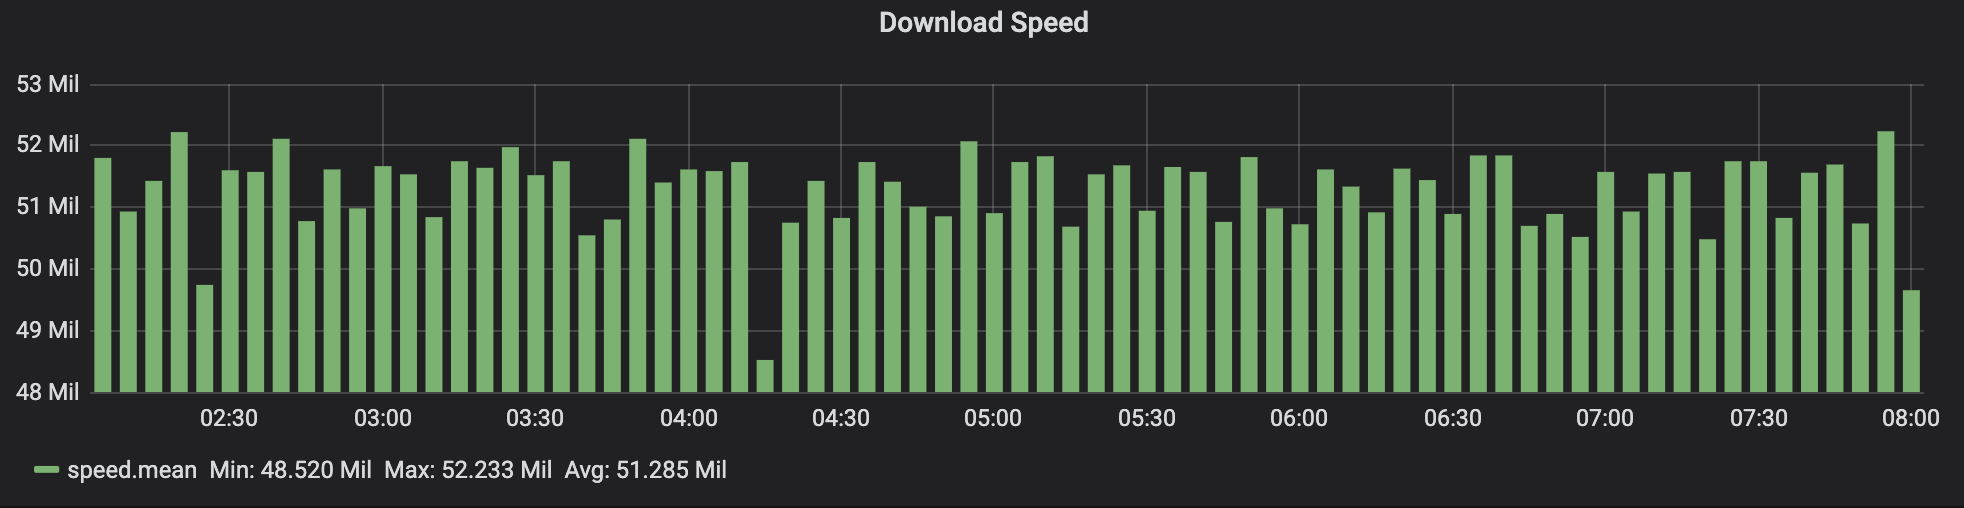
After letting this script run for a while, here are the results:
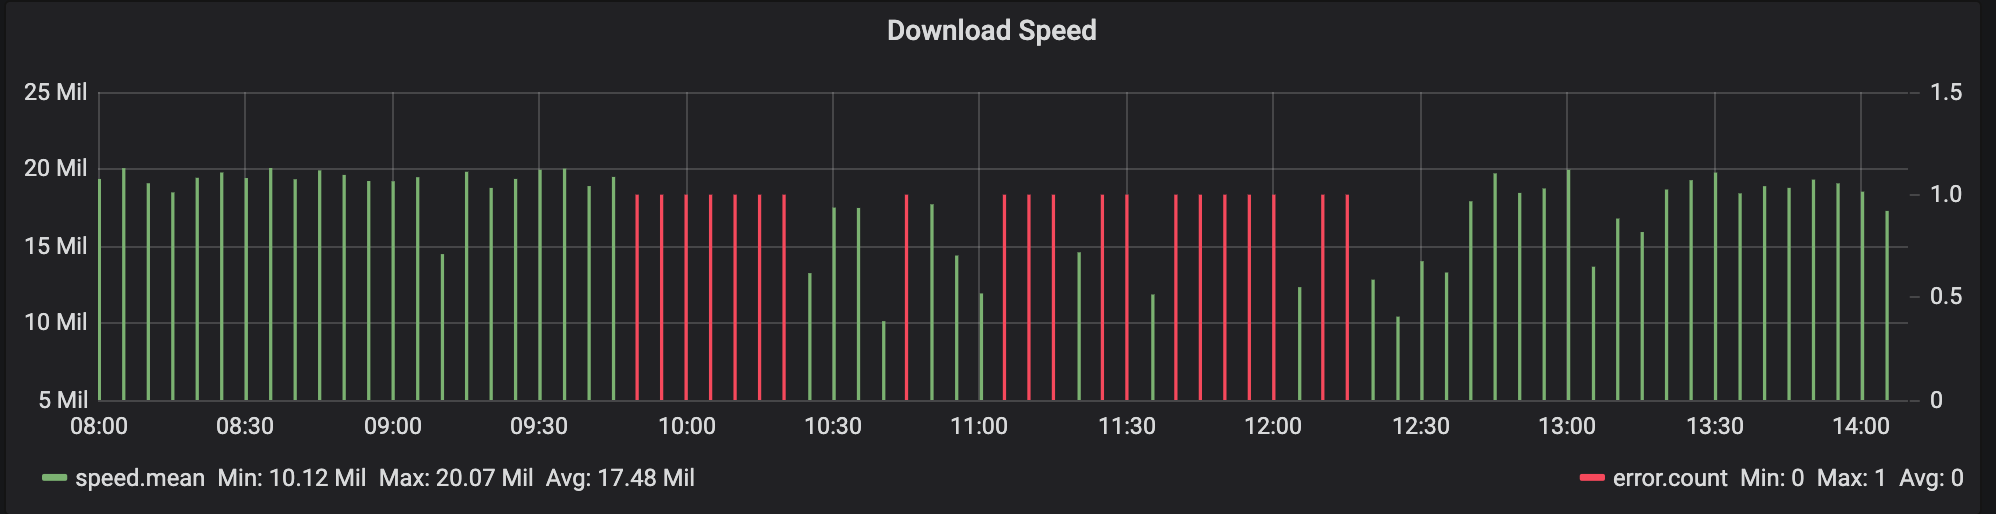
Clearly something is not right. I called ISP again and gave them more info, time frames, etc. They still played innocent.
Looking at the hardware
To my surprise, the WiFi I was testing this on was served by an additional router that’s closer to the living rooms. I traced found the “main” switch that this router was connected to and plugged in my Raspberry Pi directly via ethernet port. The results were almost perfect:
D’oh! I should have started from this, and saved myself a lot of time.
I upgraded the in-room router (802.11g → 802.11n) and reconfigured it to be a dumb access point. My WiFi problem was fixed.
Since I went this far, I figured I’d make this dashboard thing even better.
Making dashboard even better
The main router has a web-based UI. It’s not a very pretty one, but it’s definitely workable. It has all this useful info, like total bytes sent/received, info about clients, etc.
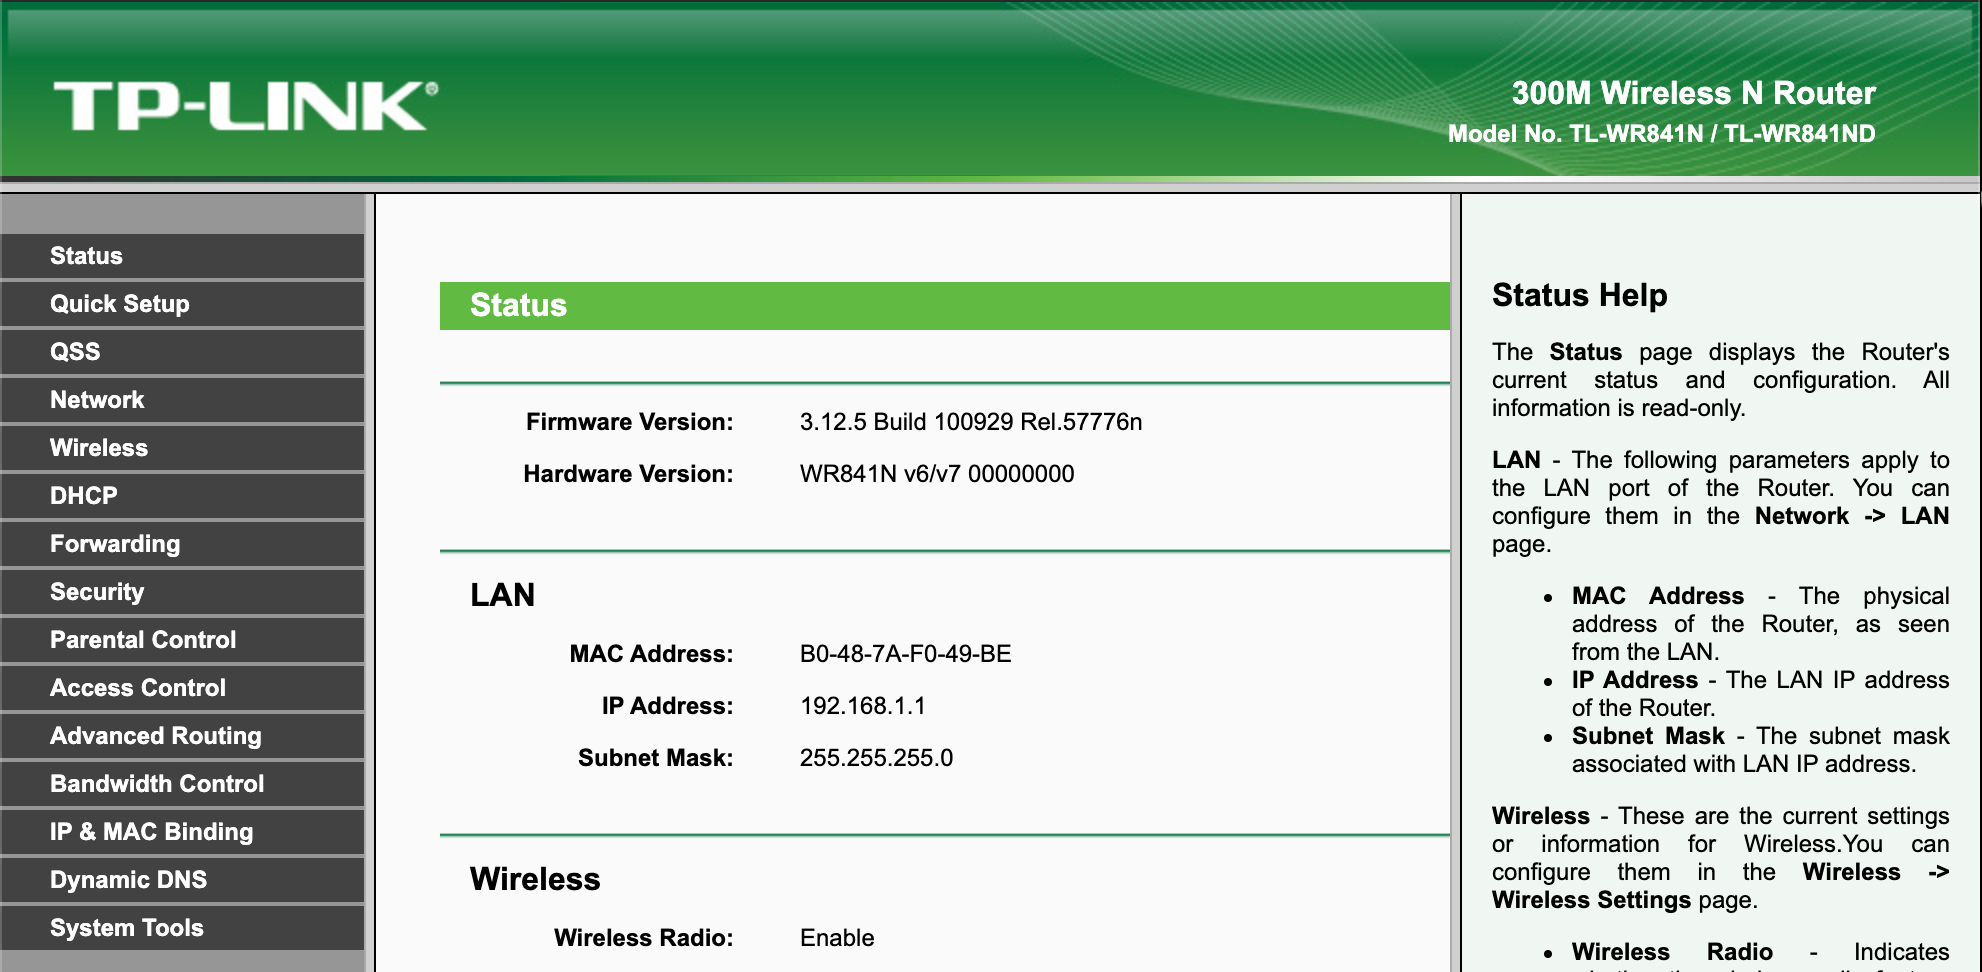
Old school Web UI with HTTP basic auth
We are all spoiled by REST and Graphql APIs these days, but the web of the past had its own charm. It was so simple.
Here’s what’s going on when I click “Refresh” stats button:
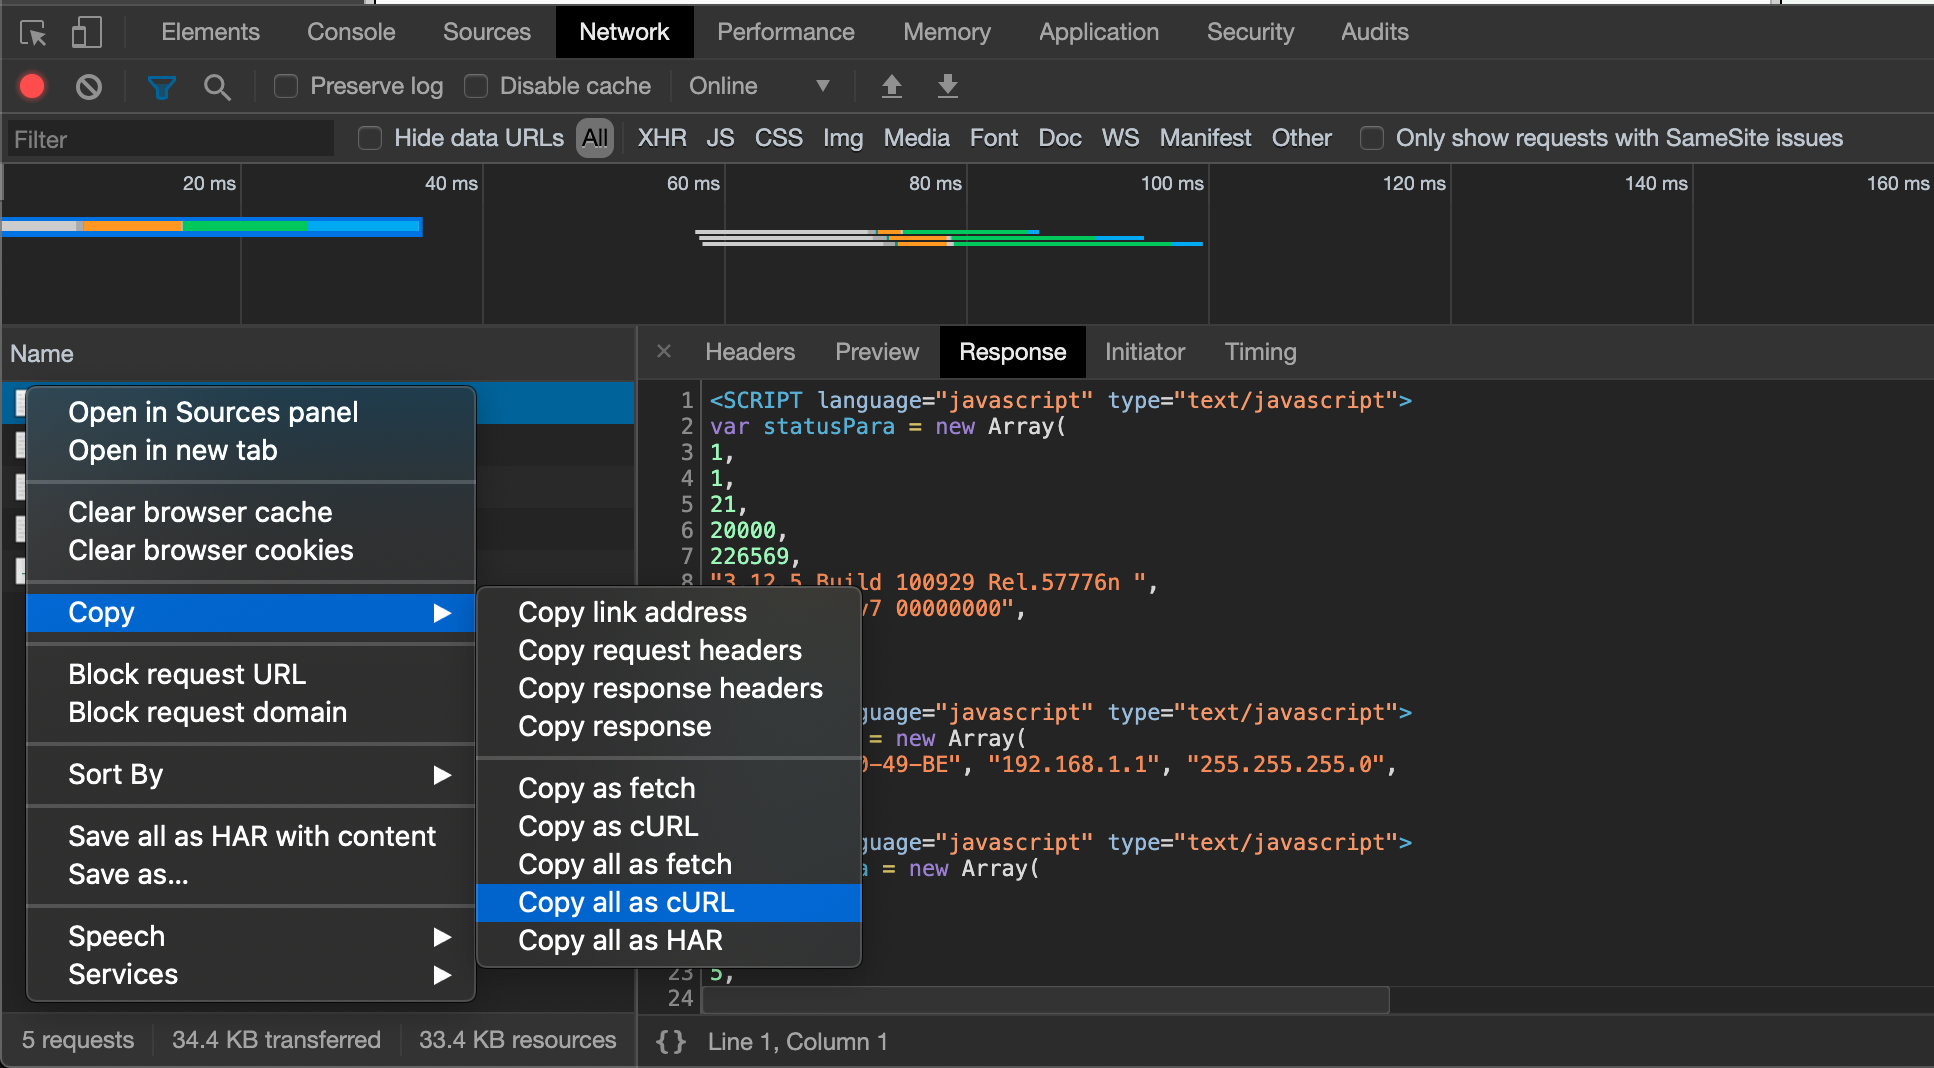
Chrome DevTools has a feature that allows you to copy the request as curl command
Glueing a few curls and greps together, I came up with this. It works, but after figuring out how to turn something into an array in Bash I wished I’d just went with Python.
#!/bin/bash

ROW=$(curl -sS 'http://192.168.1.1/userRpm/StatusRpm.htm' -H 'Authorization: Basic aHR0cHM6Ly9jdXR0Lmx5L3Z0aG1TaGE=' -H 'Accept: text/html' | grep 'var statistList = new Array' -A 1 | tail -n 1)

IFS=', ' read -r -a stats <<< "$ROW"
curl -XPOST 'http://localhost:8086/write?db=inet' --data-binary "router_stats bytes_received=${stats[0]},bytes_sent=${stats[1]},packets_received=${stats[2]},packets_sent=${stats[3]}"
Note that the router doesn’t give me the speed, just the total bytes. Fortunately, Grafana can take a derivative, of that value, giving me approximate speed at a point in time:
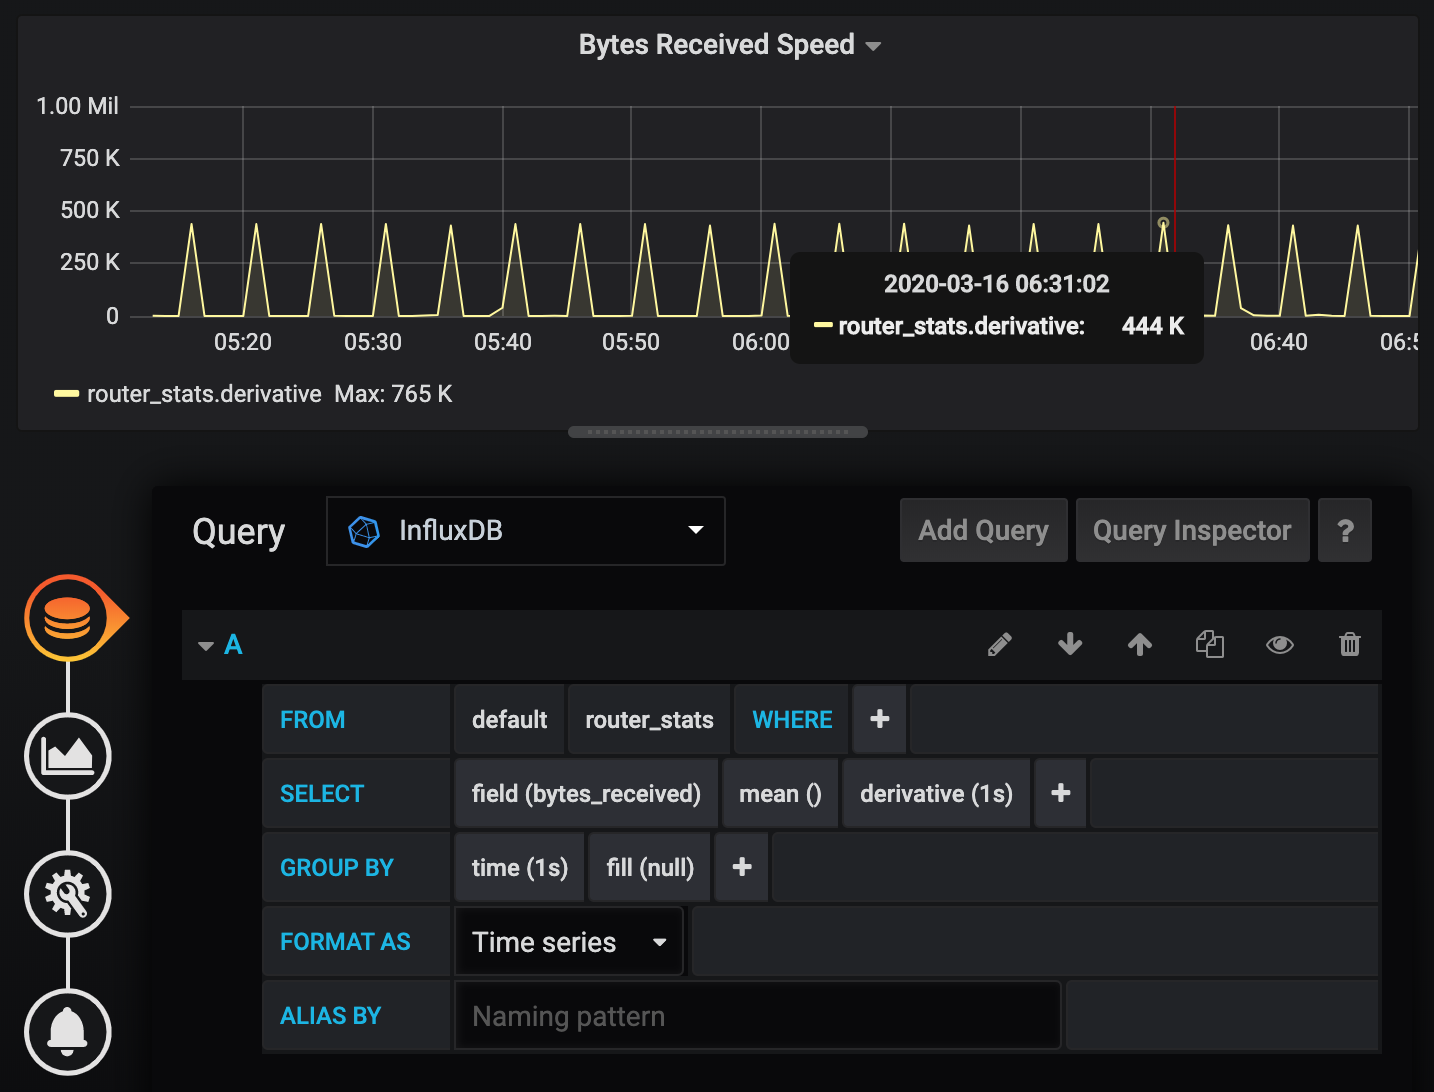
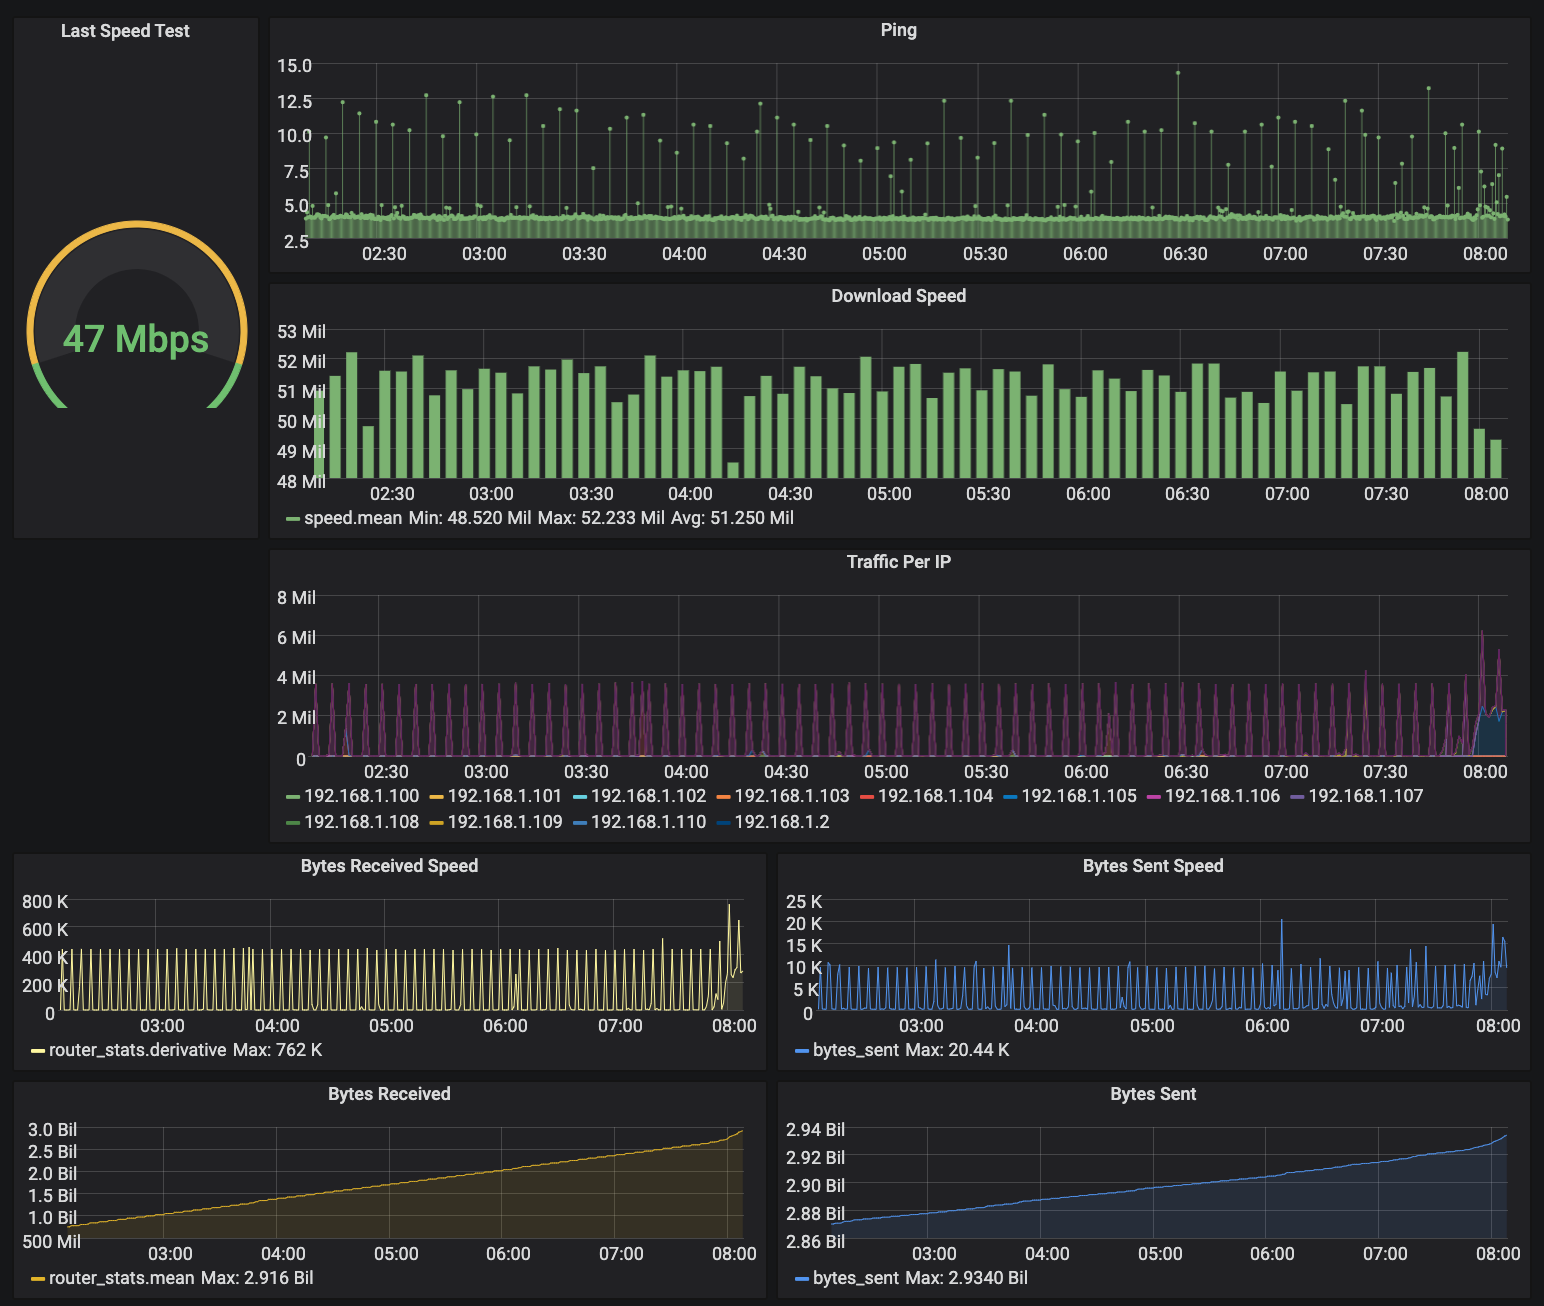
I did the same for per device stats page, ping and a few other things.
Currently, the end results looks like this: